

We have converted widgets for all companies. If you want to make sure the widgets look good or do a fresh setup with the new features, visit your account or reach out to us on our chat line.
The new app updates are available for download now, and you won’t see any difference unless you update to the latest version of the SalesScreen app.
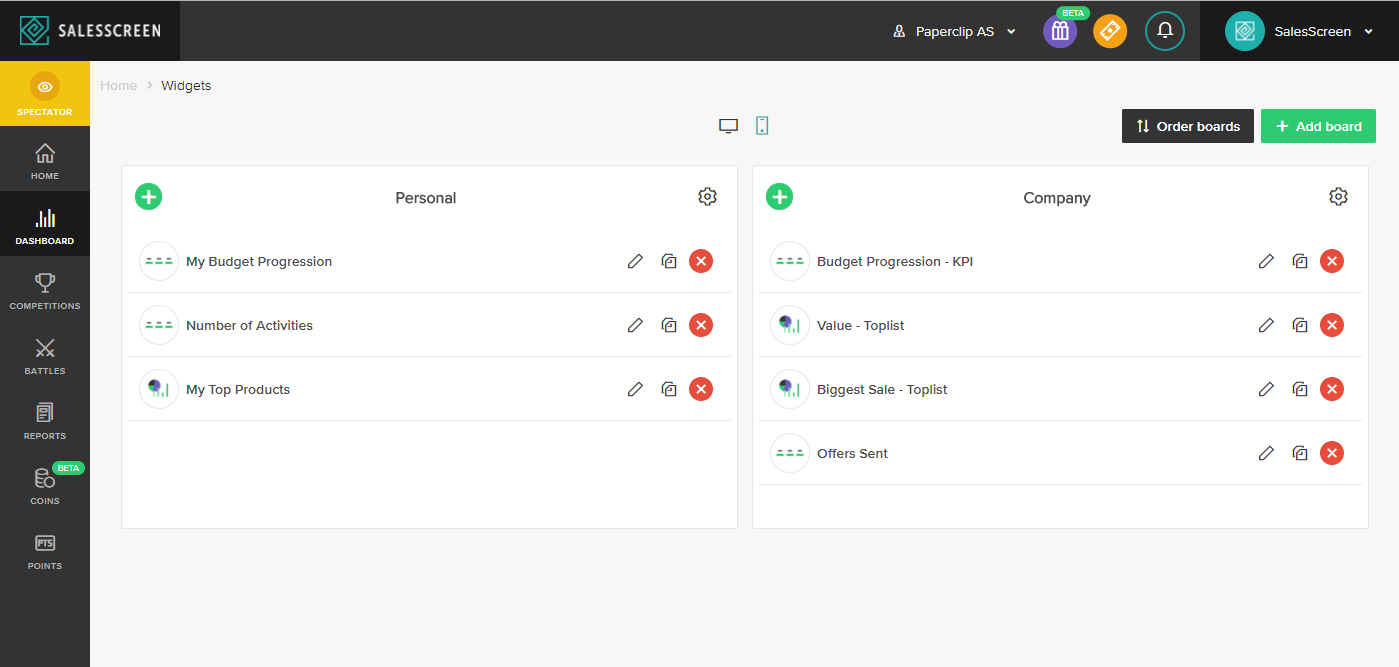
To make account adjustments, visit this link: https://app.salesscreen.com/#/dashboard/manageAppBoards/
WHAT’S NEW?
We have now made the same changes to mobile widgets as we’ve done for web widgets and slides recently: increasing flexibility and improving the setup process.
This means that you can create widgets for a specific set of users, teams, departments, products or origins. In addition, you can now manage mobile widgets on your own without needing to contact SalesScreen.
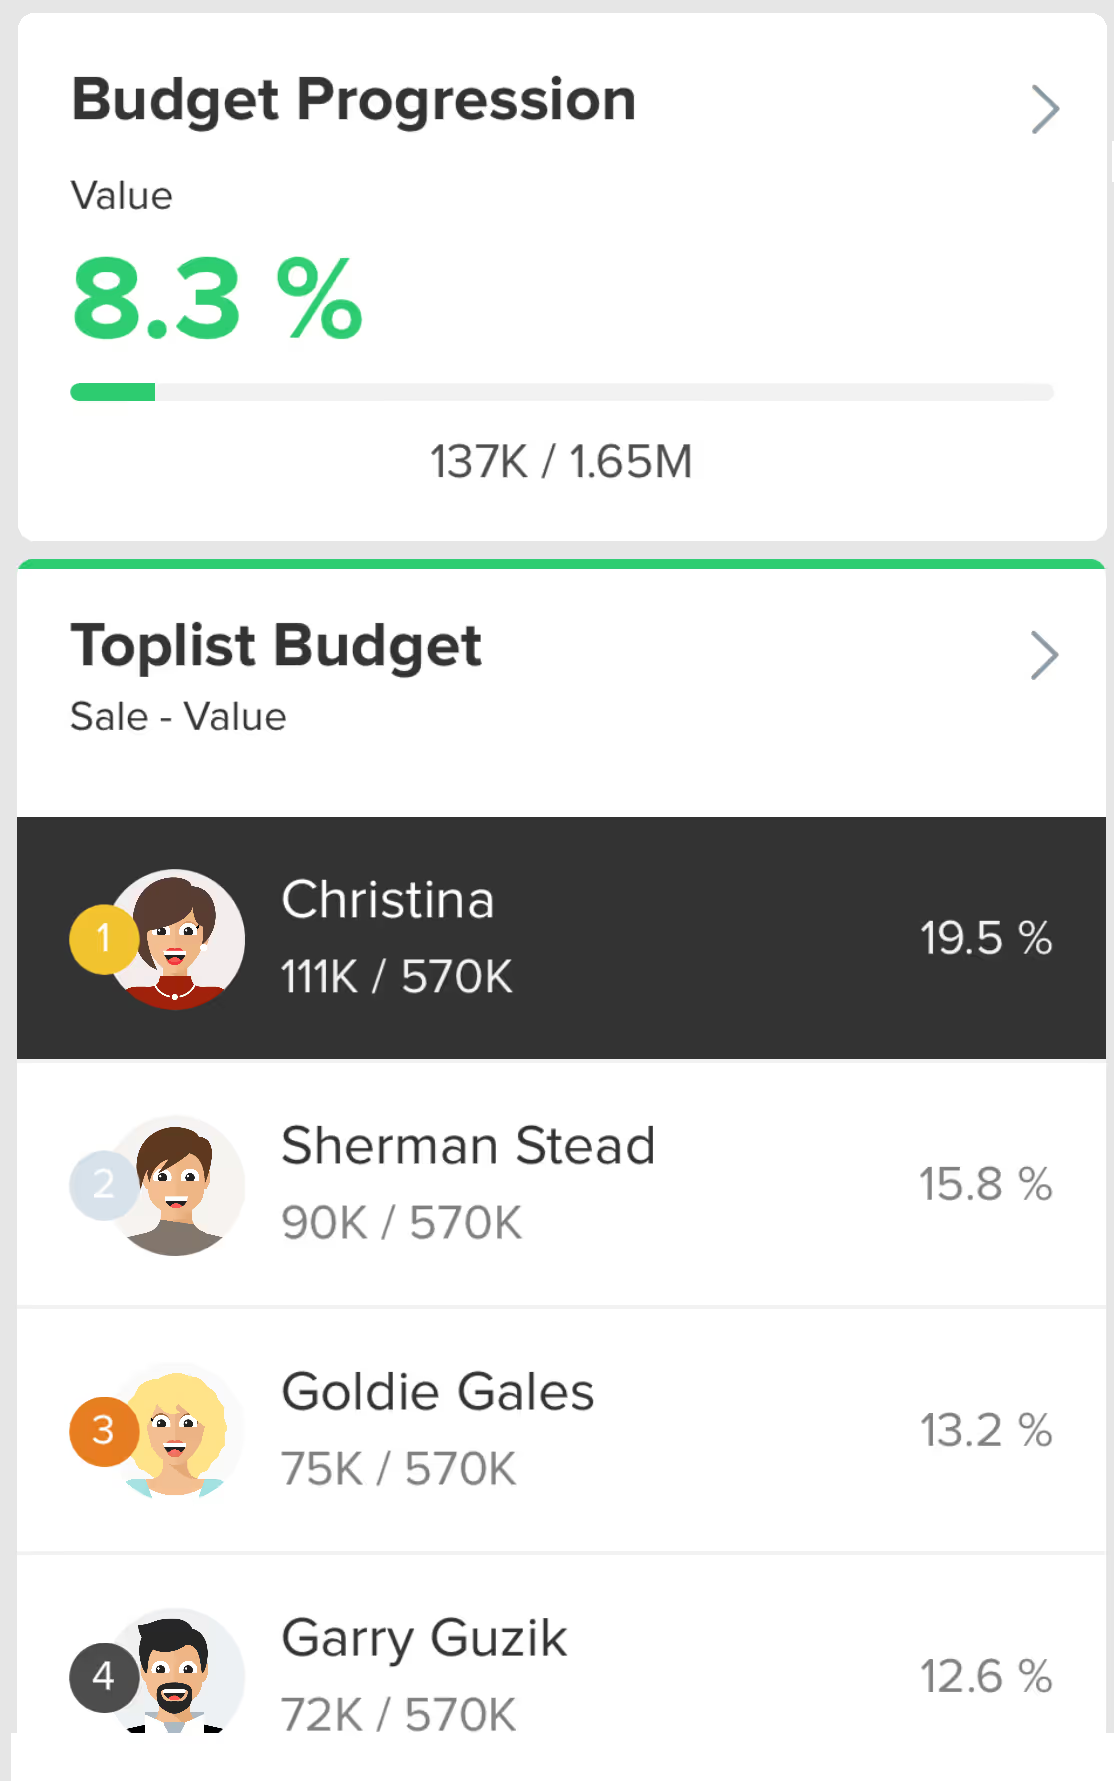
The layout update for the widgets in the mobile app is quite a bit different from what the previous version. We have focused on Toplists and KPIs. This is very close to what you can find on the web dashboard, but be aware that we don’t have any graphs available yet.
IS ANYTHING REMOVED FROM THE OLD APP?
Yes. The old statistics view will be totally gone as soon as the user updates his/her app with the new version.
Most changes are similar to what you can find on slides and widgets today. The one thing that can simplify the setup for bigger companies is the default filter (you can find it in the Display data step). The default filter defines what the widget shows for each user when they load it and is similar to Default to current user’s data on web dashboards. It has five options:
- Based on widget settings: The widget will show the same thing for everyone, without any personal differences/filters by default.
- The user: The widget will show data for the specific user that loads it. So if it is a budget progression widget, I will see my budget progression in the widget and John will see his budget progression.
- User’s team: Works in the same way as the user-setting, just for the users team as a whole instead of the user individually.
- User’s department: Same as above, but for the user’s department as a whole.
- User’s company: Same as above, but for the user’s company as a whole. Only relevant for executive widgets.
FAQ:
Q: The widget displays no data. What did I do wrong?
A: Check the usual stuff: Is there a budget available in the board period? Any reports in the period? Then, check the default filter-setting to see if that’s the thing causing problems.
Q: Why do I still see the old statistics view?
A: You didn’t update your app.
Q: Is there trouble-shooting documentation available?
A: Yes. Two articles: https://help.salesscreen.com/manage-your-dashboard/get-started/how-do-i-create-a-board-for-mobile-widgets
https://help.salesscreen.com/manage-your-dashboard/get-started/how-do-i-create-a-mobile-widget